Petfindr: Find Pets in R!
using-petfindr.RmdIn This Vignette
- Introducing
PetFindr - Getting Started
- Authentication
- Authentication
- Usage
- Functions
- Examples Using Sample Data
- Shiny
- Further Reading
Introducing PetFindr
The goal of ‘PetFindr’ is to provide a fast and friendly way to extract data from https://www.petfinder.com/, which is the largest online pet adoption website, and to facilitate data analysis and other tasks from the extracted data.
The package provides a useful tool to enable R users to search for their favorite pets in their own R session, and to browse pictures of the pets. All of this is possible thanks to API (Application Programming Interface) which is a set of instructions and standards for accessing structured information on the web. The Petfinder website provides us with an API that allows us to access the Petfinder database of hundreds of thousands of pets ready for adoption and over ten thousand animal welfare organizations.
This vignette introduces and walks through the package,PetFindr, and the Petfinder API for authenticating and extracting data from the database.
Getting Started
First, install and load the development version from GitHub with:
# install.packages("devtools")
devtools::install_github("earl88/PetFindr")
library(PetFindr)
Authentication
In order to begin, a user needs a secure authentication.
To get unique key and secret from the API website, the user has to create an account on Petfinder.pf_setup function will guide the user through whole process to initialize the API connection to Petfinder.
Running this function will open a browser to “https://www.petfinder.com/developers/” and prompt the user to register for Petfinder’s API (V2).
pf_setup()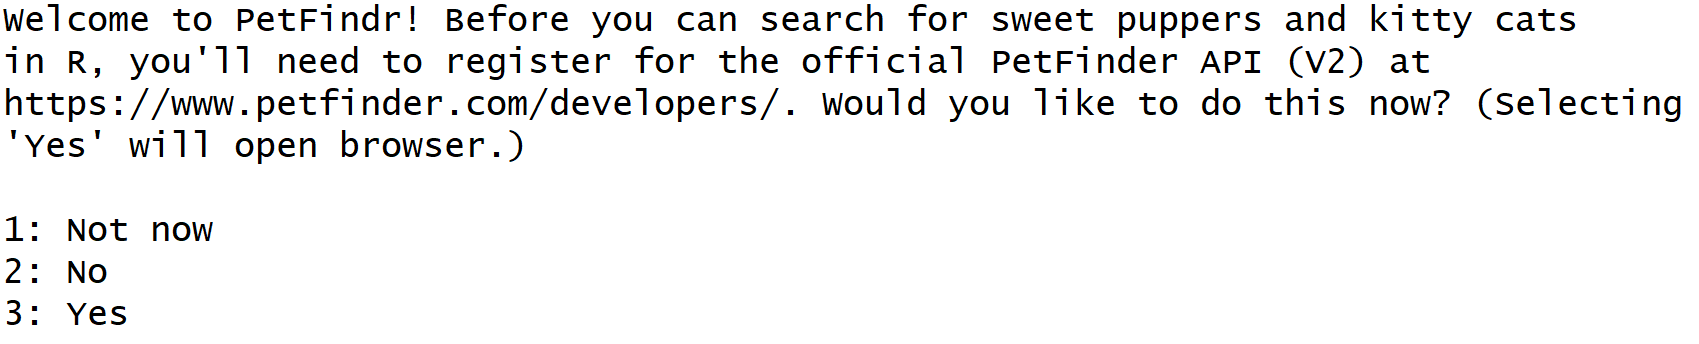
If the user responsds “yes”, pf_setup will load PetFinder register website into an HTML browser.
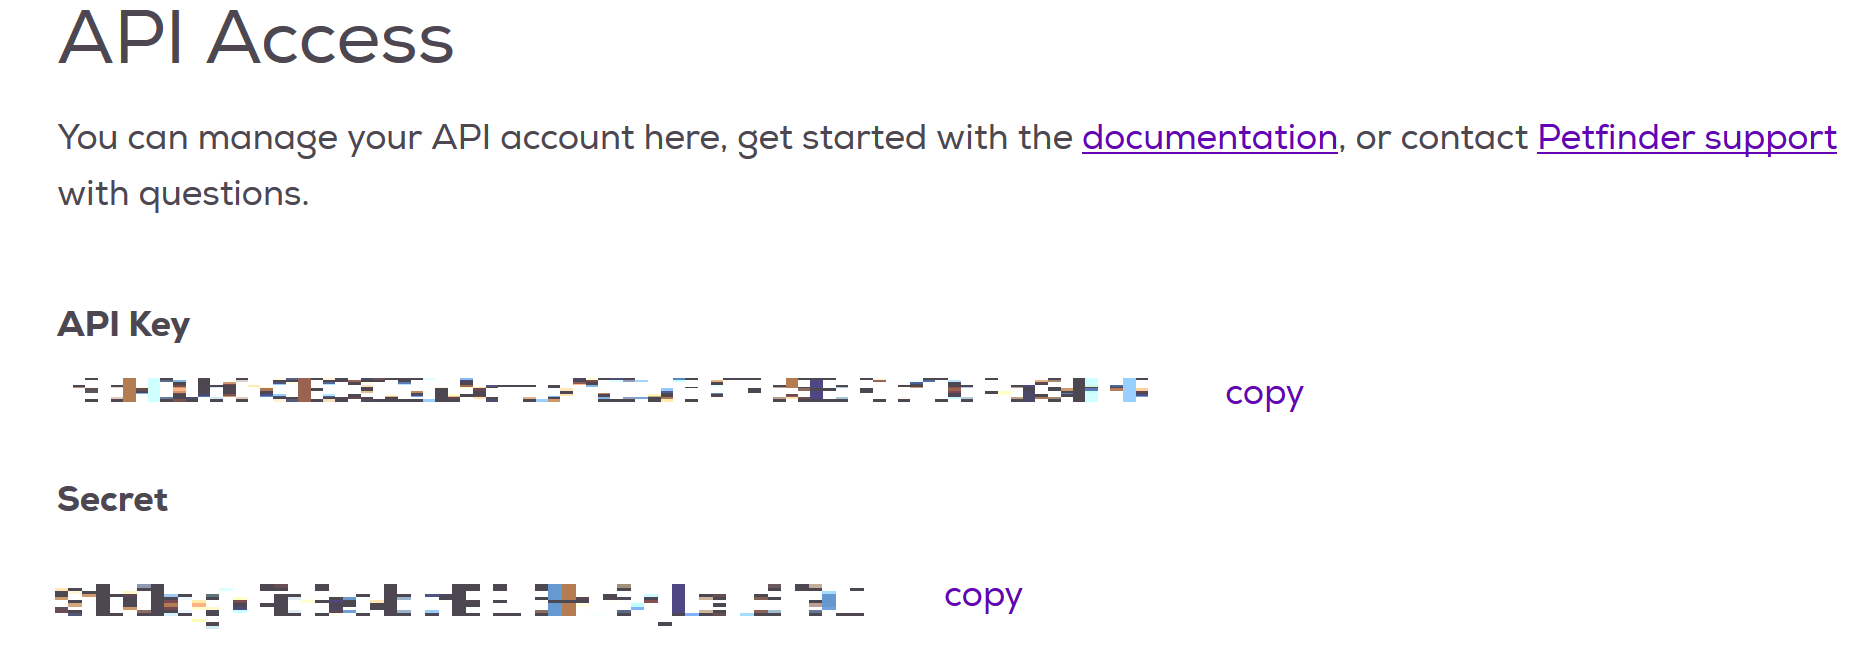
After registration, a Petfinder API key and secret can be requested in www.petfinder.com/developers.
The uniqe key and secret will be used to request an access token to Petfinder API.
pf_save_credentials(key, secret)Once the user creates an account on Petfinder and receive a unique key and a secret, the user now can use the function petfindr_save_credentials() to store their key and secret to your .Rprofile so that you do not have to run pf_save_credentials(key, secret) everytime you use the package.
Using pf_save_credentials(key, secret) makes it easier to access the API in the future, but this function is not required to access the database.
In order to maintain security, the user needs to take one more step, which is requesting an access token to get an access to API database.
pf_accesstoken(key, secret)Once the user uses key and secret as the inputs of pf_accesstoken(), the user now have an access to the Petfinder servers and can start his/her own query to find future pets.
The token has to be requested every hour.
Finally, The Petfinder API v2.0 are now accessible through R!
Usage
The Petfinder API allows users to search and view pet listings based on pet characteristics, location, and status. In addition, they can search for and display animal shelters based on the organization’s name, ID, and location.
The following section introduces the functions in PetFindr package and how to interact with the Petfinder API with some cute examples of extracting data from the database.
The examples are mainly split into pet, shelter, photo-viewing functions.
Functions
pf_find_pets
pf_find_pets allows users to retrieve a dataframe of information about pets that are listed on Petfinder.com. Filter searches are based on characteristics of animals such as animal type, breed, and gender, and organization information such as IDs, location, and distance from the selected location. Users can also make specific request to the database such as the maximum number of pets in the output and type of data sorting (e.g., most recent, the closest from the location, or random). By including a dash in the R command (e.g., “-recent”, “-distance”), a reverse-order sort is also available. For more details, list of input arguments can be found here.
Let’s say a user would like to find a list of female cats in Austin, Texas, and then one can use this function with a valid token as shown in the code below. Note that in the following example, only some of variables are shown since otherwise the output will be very wide due to the string of links in the dataframe.
library(dplyr)
pf_find_pets(token, type = "cat", gender = "female", location = "Austin, TX", page = 1) %>% select(organization_id, type, breeds.primary, age, gender, size, name, status) %>% head(n = 5)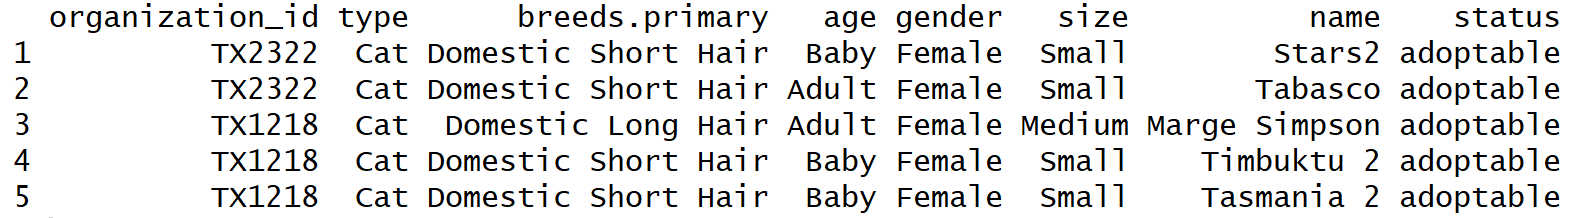
List types and breeds of pets
Two functions pf_list_types and pf_list_breeds return a list of all available types and breeds of pets on the Petfinder API. If output lists all available information on types and breeds of animals, it would take a huge amount of time for a user to filter the information he/she is actually looking for. Or, sometimes a user does not know what kind of information can be extracted using the functions. Note that there is alimiting number fo daily queries, the developers made the functions below to make the searching process easier.
pf_list_types
pf_list_types returns a dataframe with all available animal types from Petfinder.com, along with each type’s available coat, color, and gender options. There is only one argument required for this function which is user’s token. Then a tibble listing all available types with thier respective coat, color, and gender is returned by this function.
pf_list_types(token = token)
pf_list_types(token = token)$names
Anytime users call for the type of pets, the function makes a query to the API and lists all types of pets based on the latest information. There is also a list of types of pets available in the package called pf_types which can be used; however, this data set is not up-to-date and it is just a static data set created on April 2019. For more details of such sample datasets, please refer to the next section.
data("pf_types", package = "PetFindr")
pf_list_breeds
pf_list_breeds lists all available breeds of each specific type of pet listed in users’ R session and allows the user to specify an animal type found on Petfinder.com and returns a vector containing all available breeds for that animal type. Similar to pf_list_type, users’ token is required for this function as the first input. The type of the pet must be also specified by the users. The output is a character vector containing the breed names for the specified animal type is given by the function.
# error animal type must be specified
pf_list_breeds(token = token)pf_list_breeds(token = token, type = "Scales, Fins & Other")# Listing all available dog "Retriever"
dog_breeds <- pf_list_breeds(token = token, type = "dog")
dog_breeds[stringr::str_detect(dog_breeds, pattern = "Retriever") == TRUE]Similar to pf_types dataset, there is also an static sample dataset of pet breeds available in the package called pf_breeds which can be used; however, to have the most recent breeds listed in R, pf_list_breeds needs to be called.
pf_map_locations
pf_map_locations displays the location of animal shelters on a Leaflet map, and requires the token and a dataframe of animal information from pf_find_pets, as inputs. Once a user obtains an animal dataframe, pf_map_locations uses the collection of the organization IDs of those pets to make a GET request. With the GET request, the ZIP codes of those organizations are collected, and the location of the organizations are shown on a Leaflet map according to their ZIP code. That’s why the token is required to use the function.
The following code will display markers on a leaflet map, which are the locations of the animal shelters of the first 10 puppies stored in the dataset, LA_puppies which is one of the sample datasets. Such sample datasets as well as LA_puppies will be explained in the next section. The snapshot of the map is shown below.
Note that only one or a few of organizations would be shown if some of animals are from the same shelters, and none of them will be marked if the location of the organization is not updated or provided from the Peftinder API.
data(LA_puppies, package = "PetFindr")
pf_map_locations(token, LA_puppies[1:10,])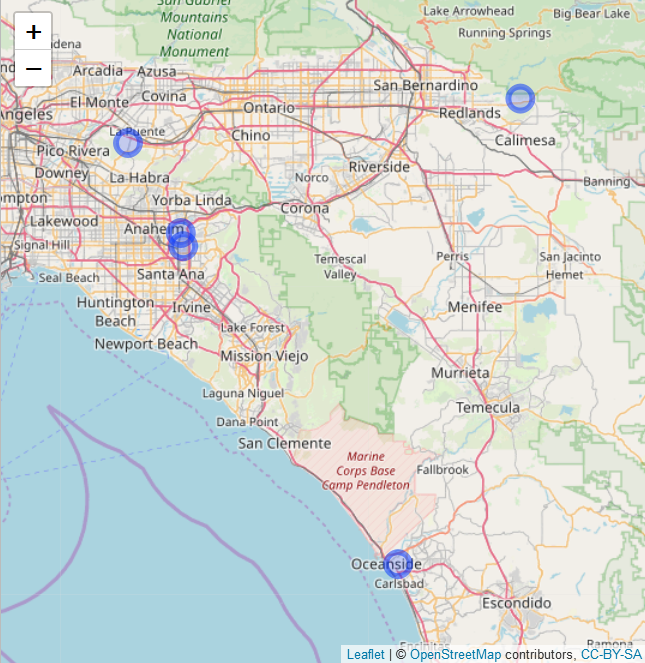
pf_find_organizations
pf_find_organizations retrieves a dataframe of information about organizations that are listed on Petfinder.com. Filter searches based on location, which can be specified by one of the following three ways: a postal code, “city-name, state-abbreviation”, or latitude and longitude. Users can also search for organizations within distance of the location by “distance” input as well as a country in which the organizations are by “country” input. Users also can choose what type of pre-sorted pages on Petfinder.com the information should be imported.date listed on Petfinder.com, the distance from the location specified in ascending or descending order, or randomly where the default setting is “recent”, which is related to the date listed on Petfinder.com.
In the following examples with a valid token, the information of 100 organizations in US in the alphabetical order of states in the first page on the website, and of the first 20 organizations by default within 50 miles in Minneaplis, MN in the order of recent date listed will be returned, respectively.
US_orgs <- pf_find_organizations(token, country = "US", limit = 100, sort = "state")
MN_orgs <- pf_find_organizations(token, location = "Minneapolis, MN", distance = 50)
pf_view_photos
pf_view_photos presents the photos of searched pets in a slideshow format where it uses a dataframe of animal information from pf_find_pets, and the size of photos as inputs. Since the sizes of photos provided from the Petfinder website are “small”, “medium”, “large”, and “full”, one or more of them can be specified, and all sizes of photos will be shown by the default. In case there is no photo in the animal dataframe, an error message, “No photos found :(”, will be printed. The following example of code will show a slideshow of small photos of puppies in LA.
data(LA_puppies, package = "PetFindr")
pf_view_photos(LA_puppies[1:10,], size = "small")
Examples Using Sample Data
The developers have stored sample datasets extracted from Petfinder,
because it can be useful to include example datasets in the R package, to illustrate how the datasets are structures and how it can be leveraged to explore your interests in pets.
The datasets in the package are immediately available when the package is loaded.
Sample data: Puppies in Los Angeles
The dataset summarises information of 500 puppies in Greater Los Angeles area extracted from Petfinder on April 25, 2019. Output below is the first observation from the dataset.
LA_puppies %>% head(n = 5) %>% select(id, organization_id, type, species, name,age,gender, size, status)
#>         id organization_id type species  name  age gender   size    status
#> 1 44543735           CA448  Dog     Dog  Cola Baby Female Medium adoptable
#> 2 44543736           CA448  Dog     Dog   Pop Baby   Male Medium adoptable
#> 3 44541265          CA2510  Dog     Dog Clyde Baby   Male Medium adoptable
#> 4 44541241          CA1066  Dog     Dog  Echo Baby   Male Medium adoptable
#> 5 44541240          CA1066  Dog     Dog Ernie Baby   Male Medium adoptable
Note the output does not show every column in the sample dataset (otherwise the table would be very wide). Detailed information on the variables can be found here. Using the data, a user can perform various kinds of explanatory data analysis. For example, if a user wants to know what breed is the most common breed of dogs can be found in the animal shelters at Los Angeles. Top 10 breeds in Los Angeles area on April 2019 would be
names(sort(-table(LA_puppies$breeds.primary)))[1:10]
#>  [1] "Chihuahua"           "Terrier"             "German Shepherd Dog"
#>  [4] "Labrador Retriever"  "Pug"                 "Shepherd"
#>  [7] "Maltese"             "Dachshund"           "Pit Bull Terrier"
#> [10] "Husky"
The result can also be visualized as below.
library(ggplot2)top10 <- LA_puppies %>% filter(breeds.primary %in% c("Chihuahua","Terrier","German Shepherd Dog","Labrador Retriever" ,"Pug" ,"Shepherd", "Maltese" ,"Dachshund" ,"Pit Bull Terrier","Husky" ))
## Reorder puppies by frequency
top10 <- within(top10,
breeds.primary <- factor(breeds.primary,
levels=names(sort(table(breeds.primary),
decreasing=TRUE))))
## Create a bar plot
top10 %>% ggplot(aes(x = breeds.primary, fill = gender)) + geom_bar() + coord_flip()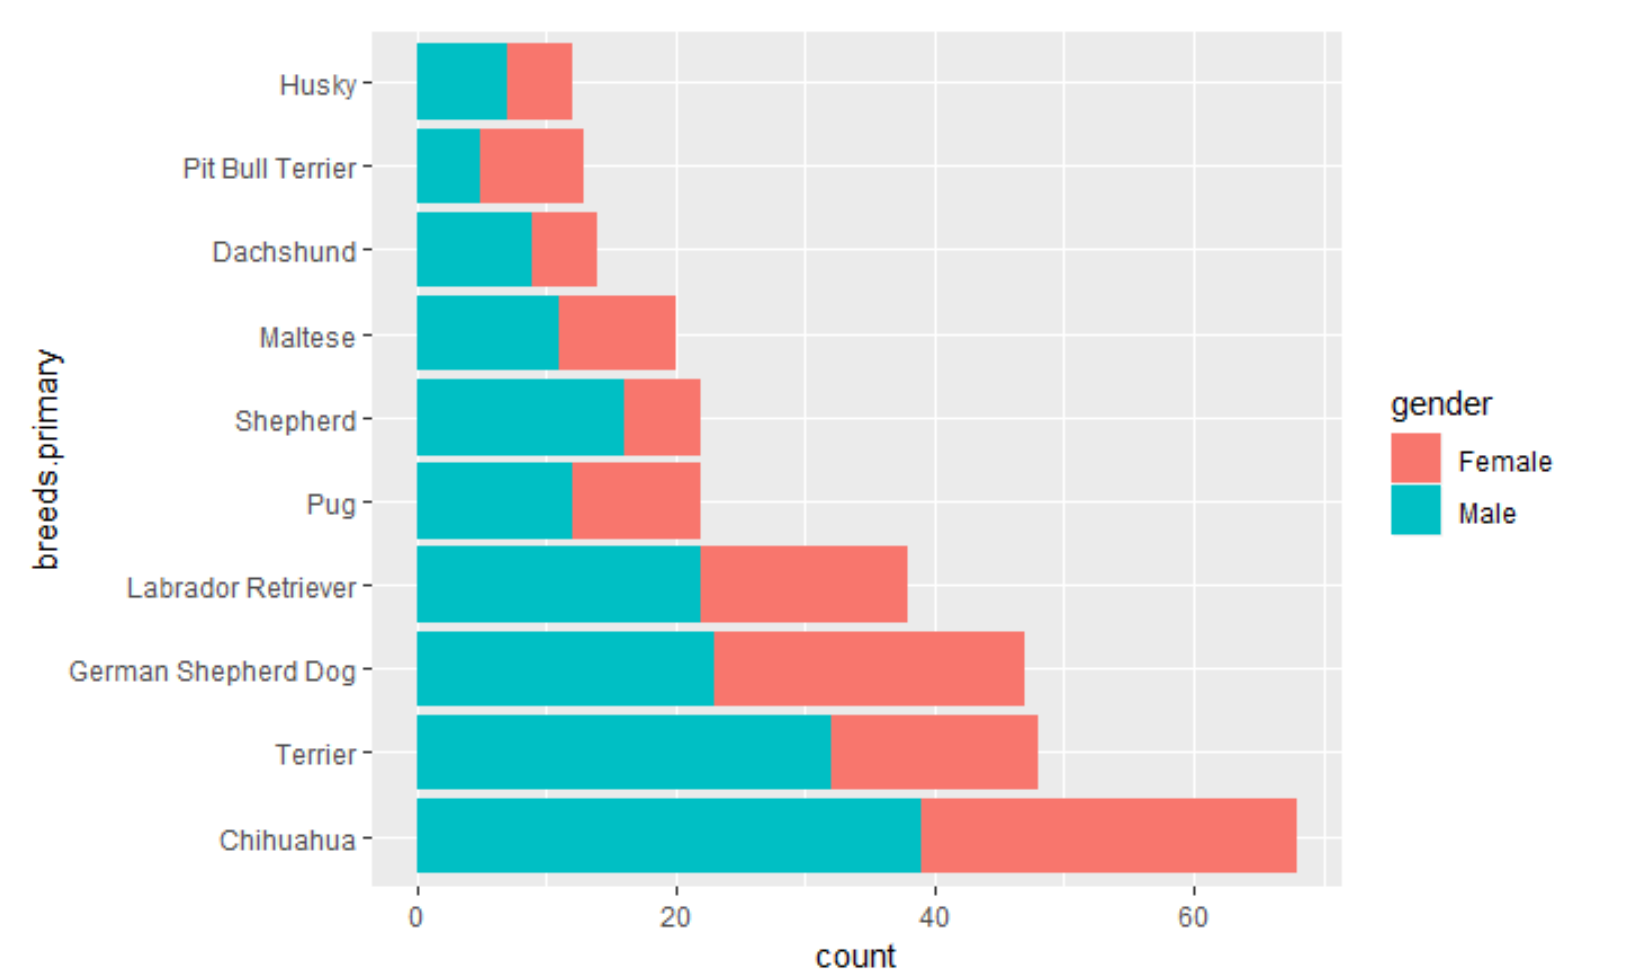
Through a visualization, the user can conclude that these are the most common puppy breeds (top 10) found at LA animal shelters. Or, a user can conduct a time series analysis. Let’s create a time series plot to see when the animals are posted on Petfinder.
## Create a time variable
LA_puppies$published_at <- lubridate::date(ymd_hms(LA_puppies$published_at))
LA_puppies %>% group_by(published_at) %>% summarise(n = n()) %>% ggplot(aes(x = published_at, y = n)) + geom_line() + geom_point() + ggtitle("Time Series of Animal Posting in LA") +
           xlab("Date") + ylab("Number of Postings")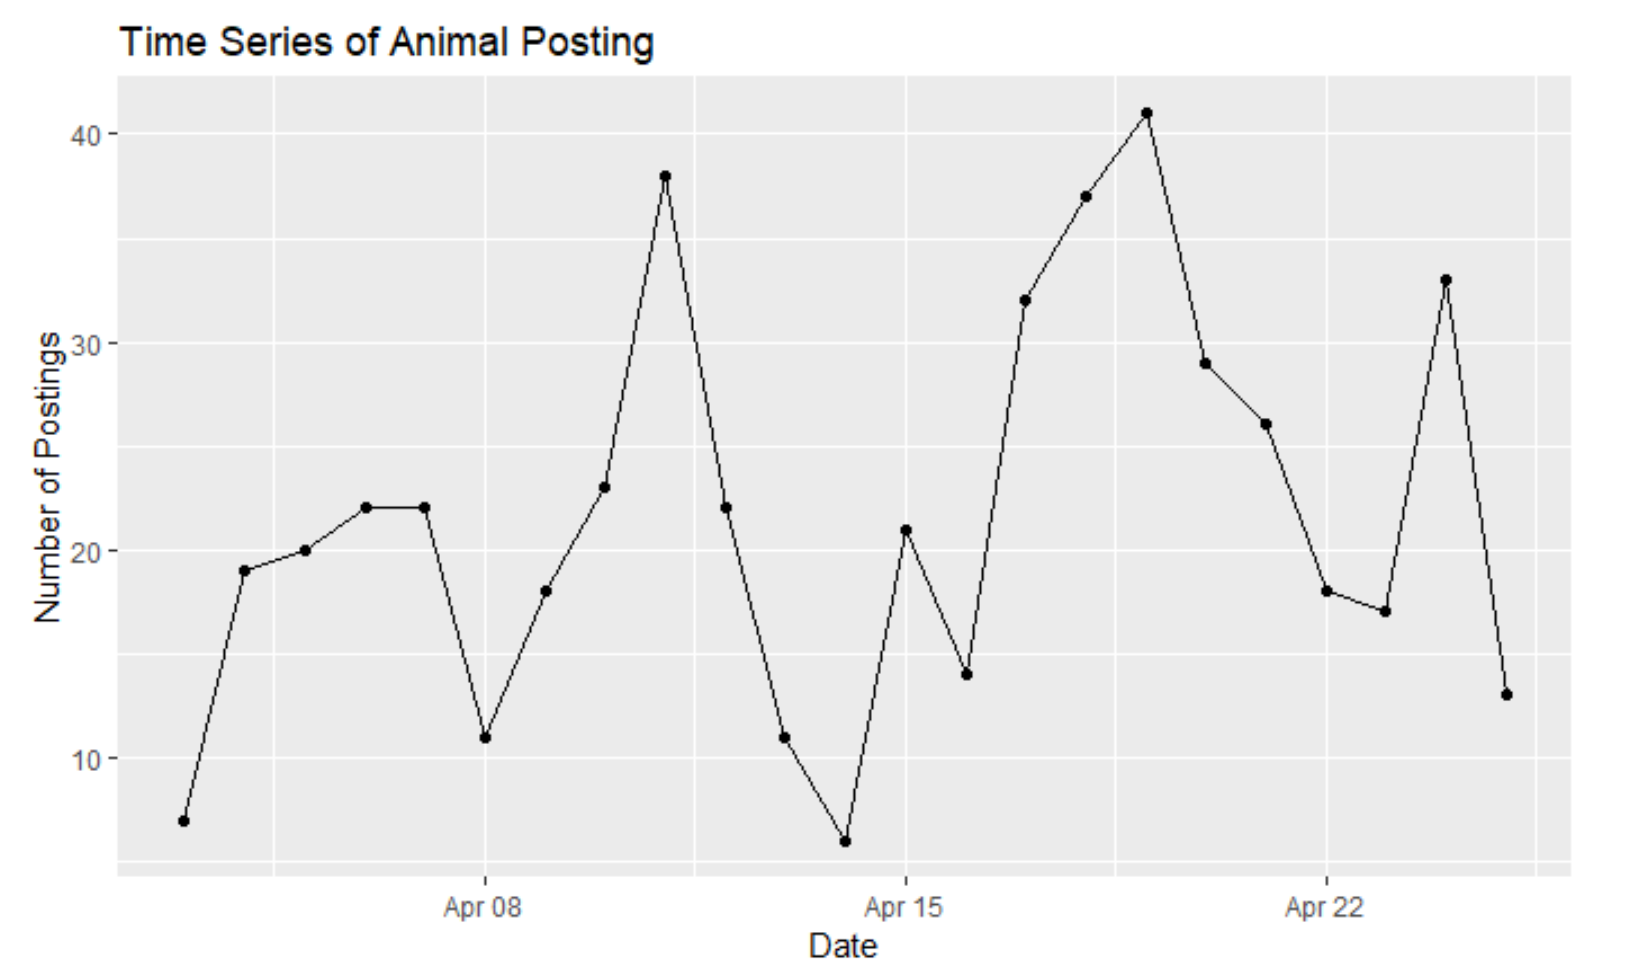
Sample data: Shelters in New York State
The dataset summarises the list of animal sheters in New York State extracted on April 2019.
Output below is the first observation from the dataset.
NY_orgs %>% head(n = 5) %>% select(id, name, phone)
#>       id                         name           phone
#> 1 NY1351           Zero Stray Pawject  (917) 929-5756
#> 2  NY606 Zanis Furry Friends ZFF, Inc            <NA>
#> 3  NY995       Yorkie911 Rescue, Inc. 631-965-6418
#> 4  NY716  Yonkers Humane Society Inc.  (914) 751-7870
#> 5   NY63       Yonkers Animal Shelter  (201) 981-3215
Note the output does not show every column in the sample dataset (otherwise the table would be very wide). Detailed information on the variables can be found here Similar explanatory analysis can be conducted for the dataset as well.
top10_orgs <- NY_orgs %>% filter(address.city %in% c("New York","Brooklyn","Rochester", "Albany",        "Staten Island", "Buffalo" ,"Flushing","Binghamton","Syracuse","Bronx"))
top10_orgs <- within(top10_orgs,
                   address.city <- factor(address.city,
                                      levels=names(sort(table(address.city),
                                                        decreasing=TRUE))))
top10_orgs %>% ggplot(aes(x = address.city)) + geom_bar() + coord_flip()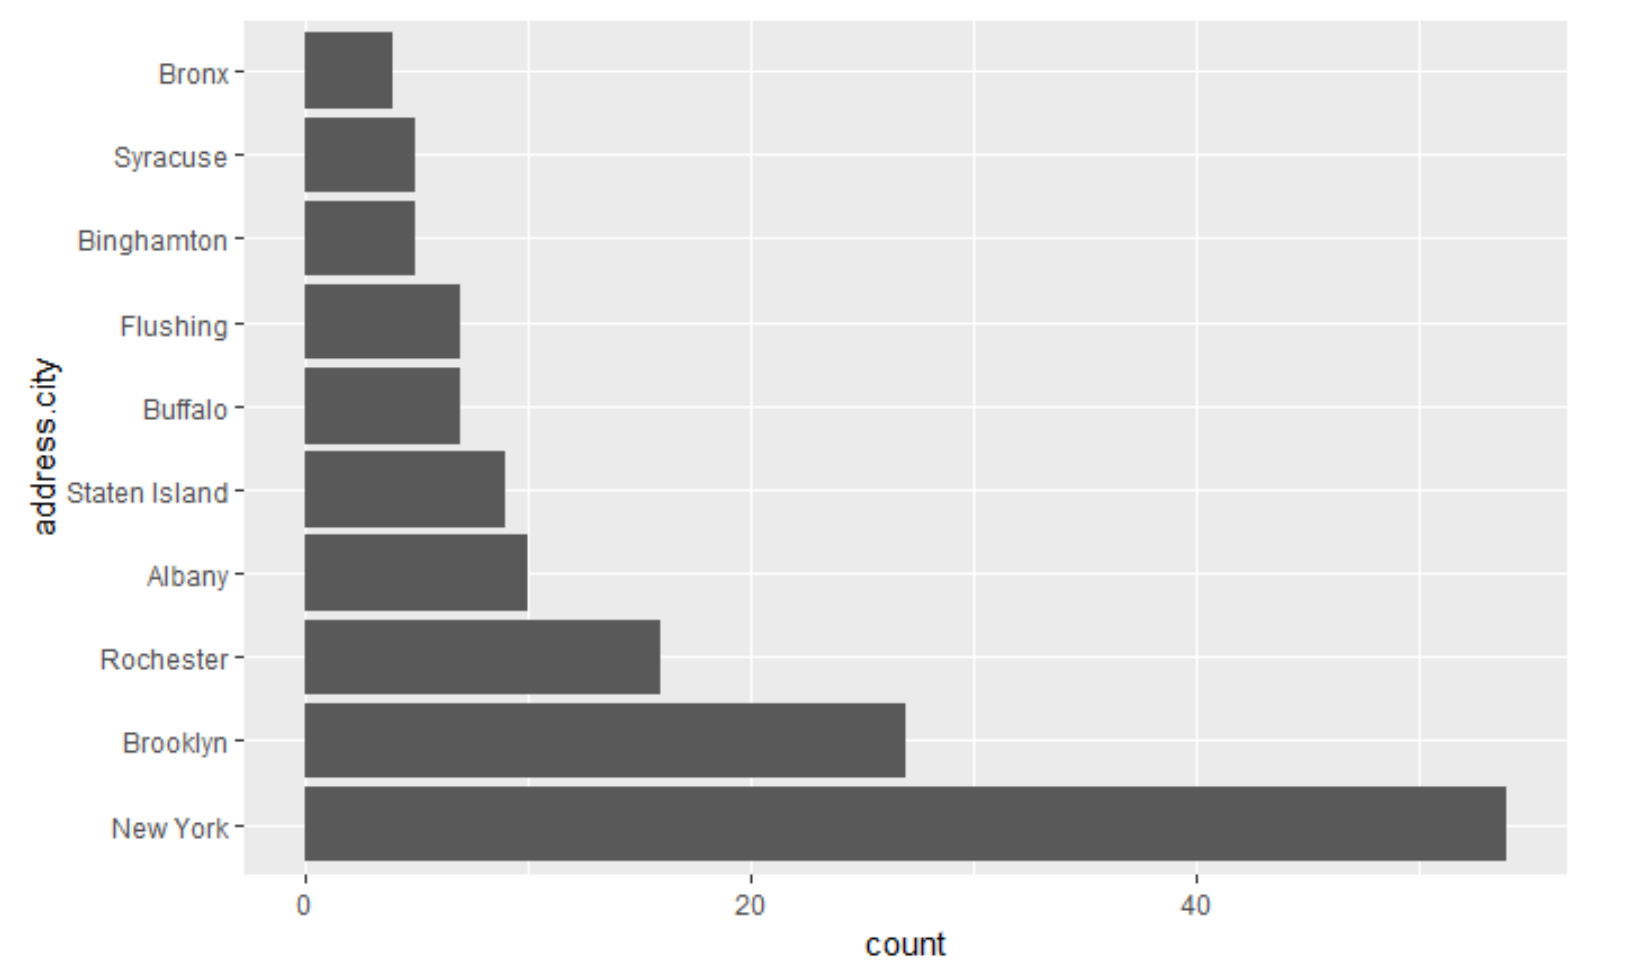
The bar plot indicates that most of the shelters in New York state is located in New York city.
Shiny
The Shiny is a convenient way to explore data through an interactive user interface in the user’s default browser straight from R. This section of the vignette will present a couple of examples to show users how to explore Petfinder using R Shiny.
Detailed information on R Shiny could be found here. A user also needs an authentication to use the Shiny because Shiny extracts data from real-time information from the API.
The app includes multiple ways to extract and visualize data from Petfinder. All of the outputs on the Shiny app can be created directly in R as well. To run the app, load the PetFindr package, and run the pf_run_Shiny() function:
library(PetFindr)
library(shiny)
pf_run_Shiny()
The computer’s default browser will open up and display the following pages:
Authentication
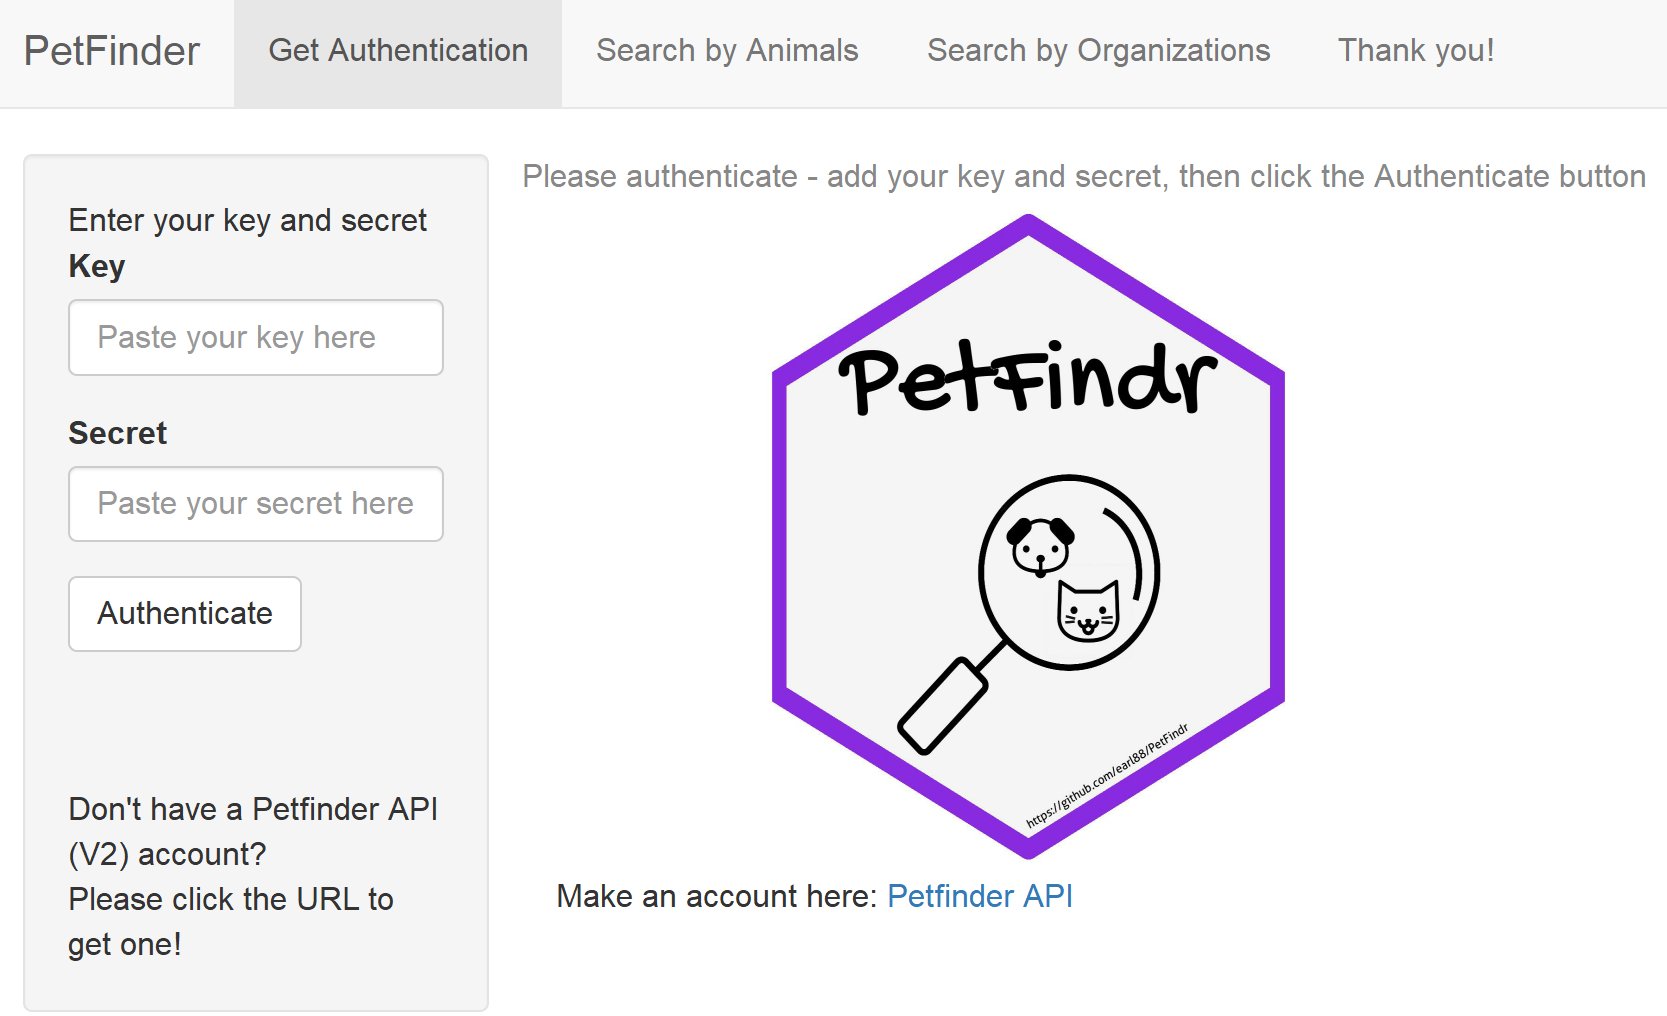
To ensure that the users are registered and have their own key and secret, the main page of the Shiny app shows a short instruction to let the users know that key and secret are required to use the Shiny app and the token has to be regenerated every hour.
The shiny app also detects invalid key and secret.
Search by Animals
After the users are granted to access the API, they can search animals as below.
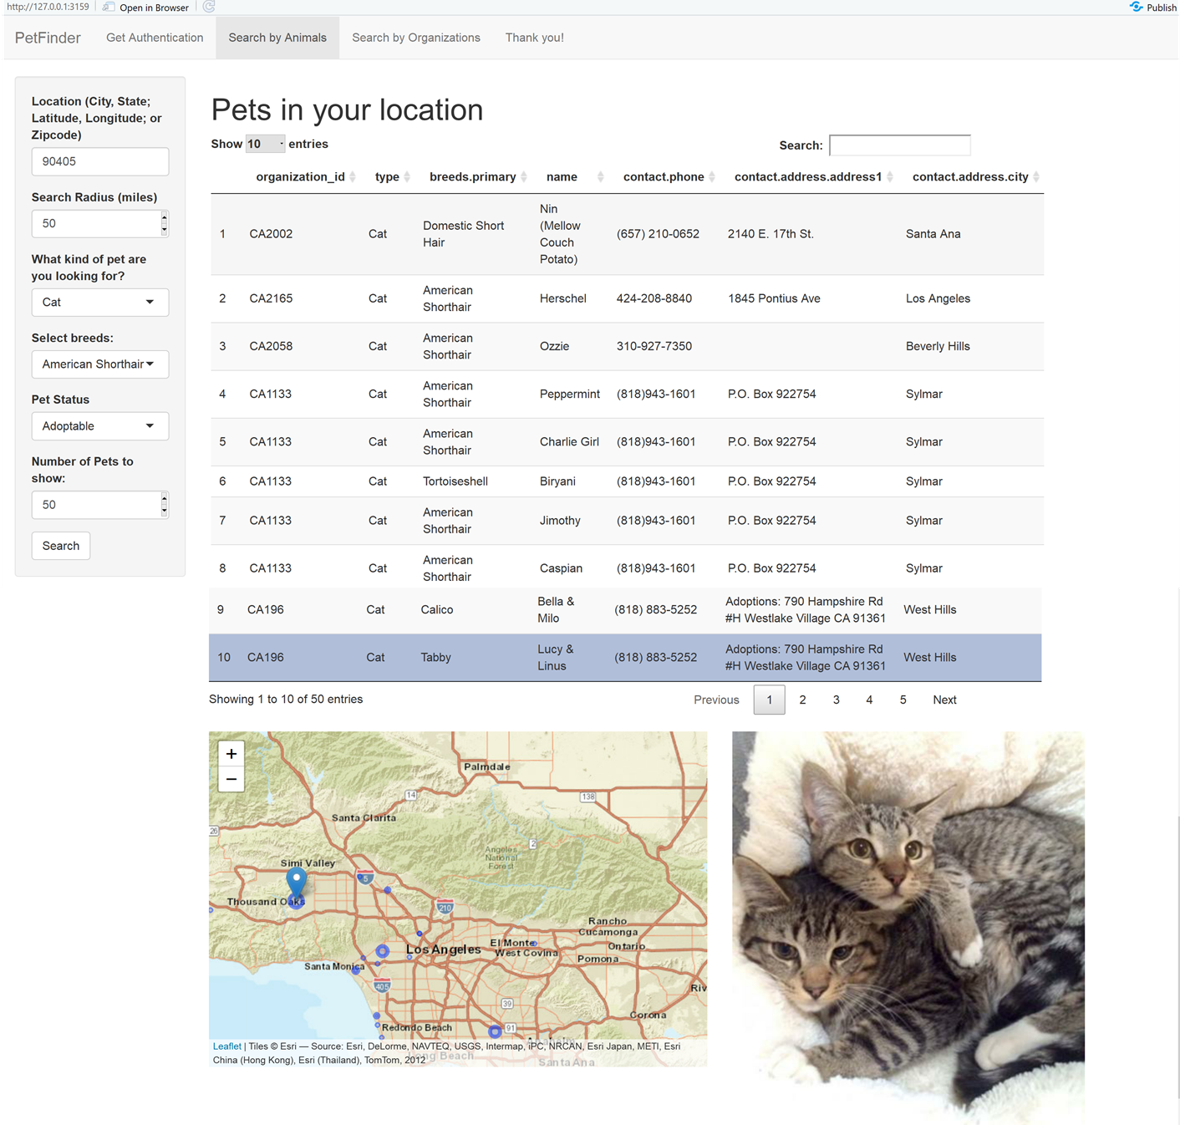
The first tab is divided into 4 main sections: The left sidebar is used to input the required information (location, search radius, types of animals, breeds of animals, adoption status, number of pets in the output) to request the AP to search for pets that meet certain criteria. Three types of queries can be made in location. A postal code, city-name, state-abbreviation and latitude and longitde information. To select distance from the location, the location input must be specified first. Pets in your location is a table output that displays the list of pets from the output. The main visualization display section shows a leaflet output to visualize the location of the pets. Finally, if a user click one of the rows in Pets in your location table, app will display a picture of the selected animal. If the photo is unavailable, it will return an error message.
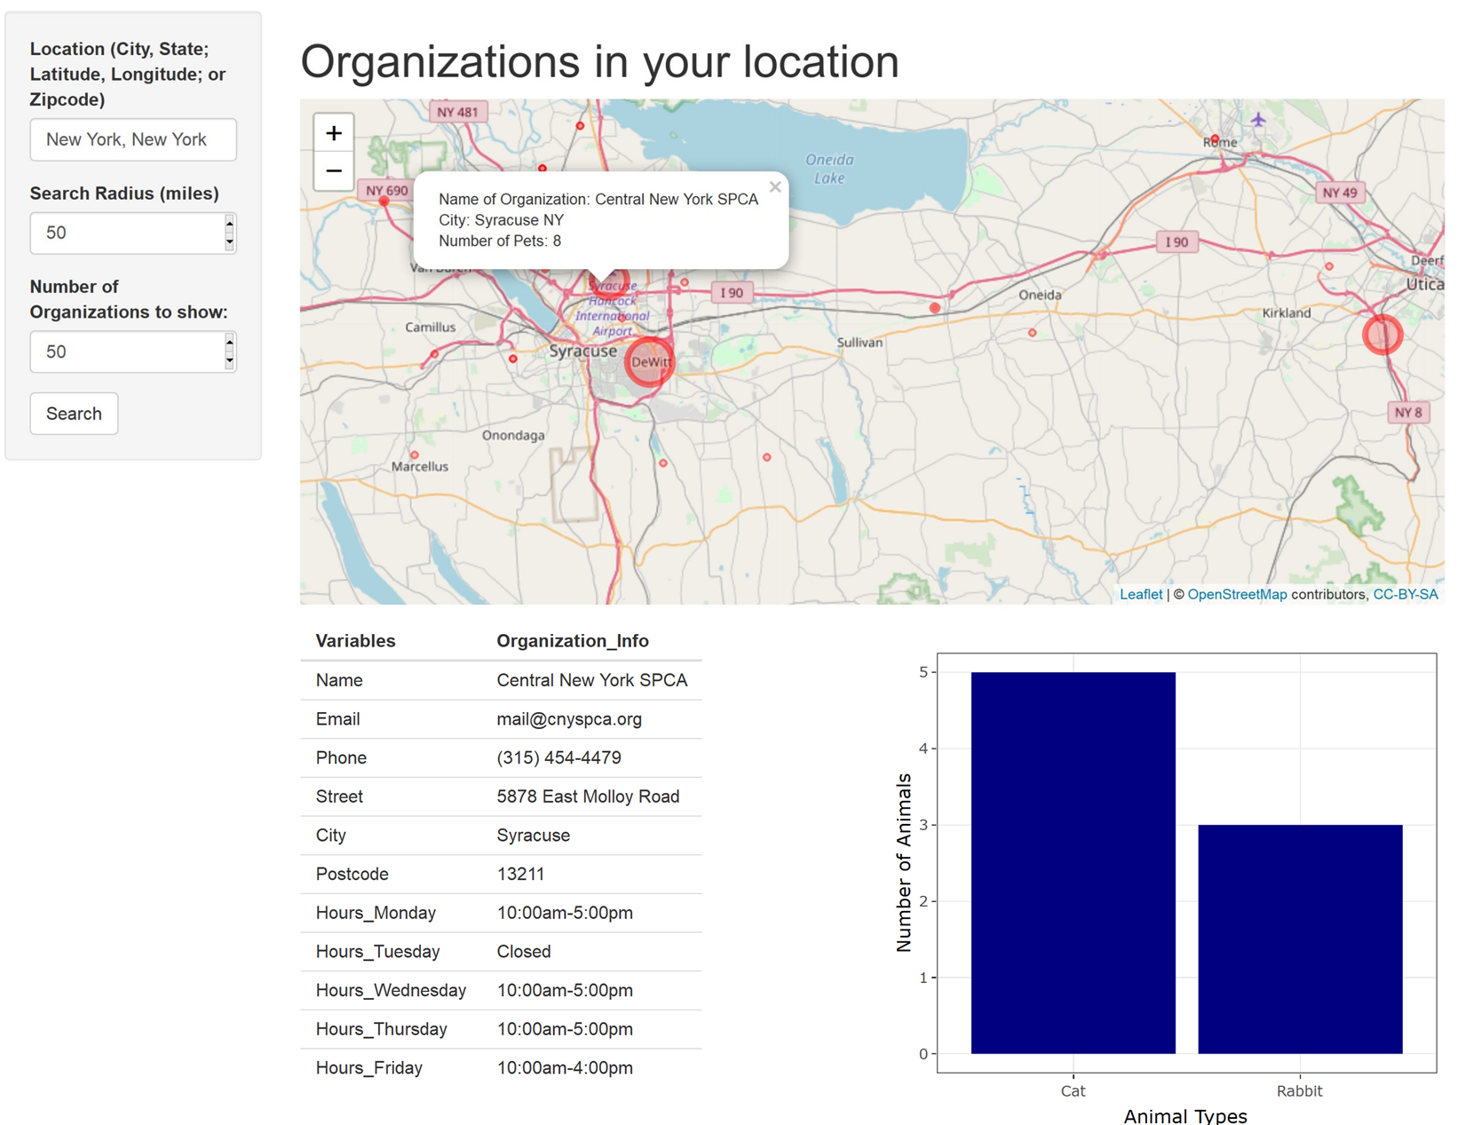
Search by Organizations
Second tab allows users to find information on animal shelters and is also divided into 4 main sections.
A user can search organization based on 3 criteria (location, search radius , and number of outputs.
The main visualization display shows three types of information.
First, it shows a leaflet map to visualize the location of the animal shelters,
and the table below shows information from a selected shelter in the leaflet map.
Finally, the bar graph summarizes the types and number of pets in the selected shelter.
Further Reading
- For further documentation on Petfinder APIs (v2), see https://www.petfinder.com/developers/v2/docs/